Ask three marketers how they measure AI search visibility and you may get three different answers: a rank tracker, a screenshot of a chatbot, and a traffic chart. Each captures something real, and each can mislead on its own. Leaders then ask a reasonable question, “Is it working?”, and nobody has a number everyone trusts.
This guide proposes a way out. It defines a compact set of AI search visibility KPIs, shows how to calculate and interpret each one, explains how to set baselines when no industry benchmark exists, and shows how to report the results. It is about what to measure and why. For how to set up each data source, see our guide to tracking your website visibility in AI search.
The AI search visibility KPIs worth tracking fall into four layers: eligibility (can systems reach your content), visibility (how often you are mentioned and cited), quality (whether you are described accurately and favorably), and outcomes (visits, branded demand, and conversions). Report visibility as rates across many prompts, not as rankings, show ranges instead of single points, and tie every KPI to a decision.
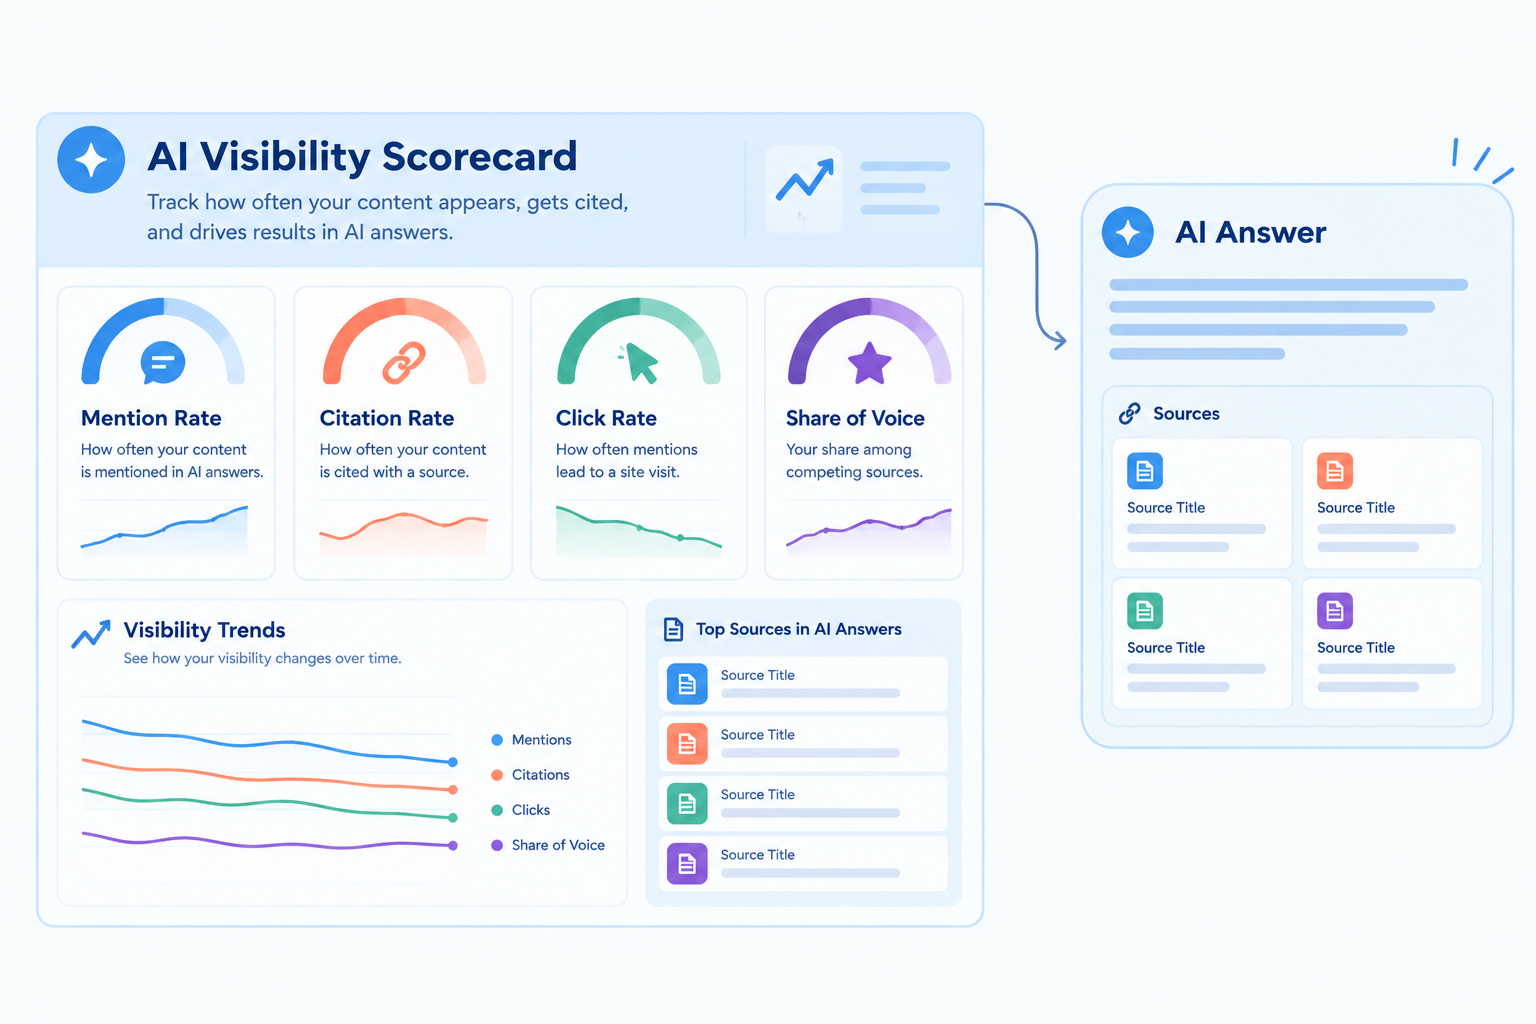
Why the Old KPIs Fall Short
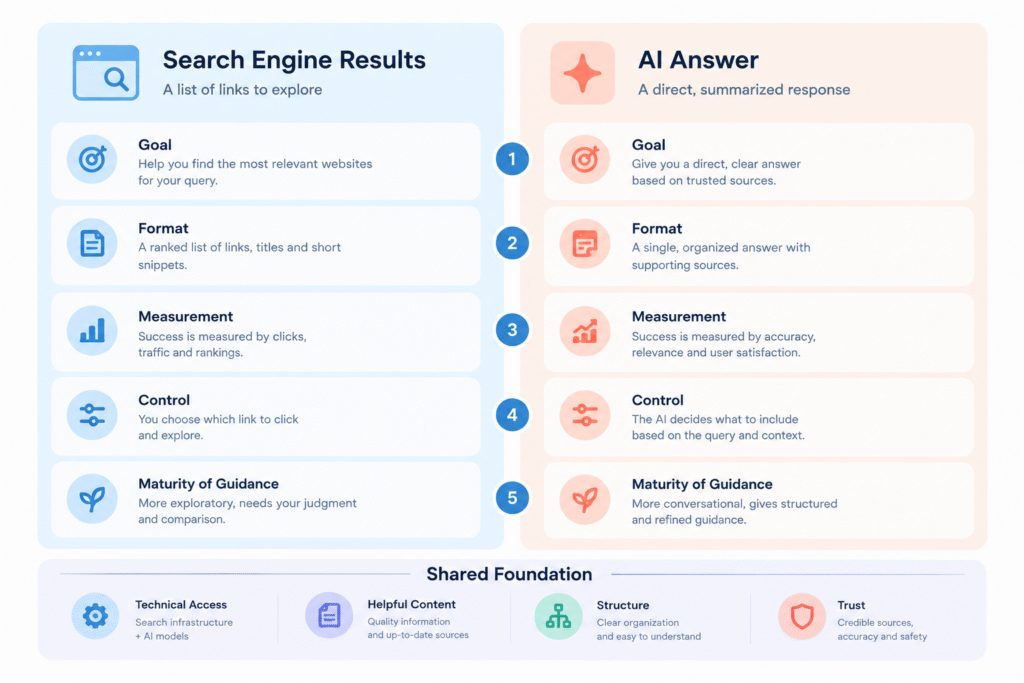
Classic SEO reporting rests on three ideas: a page has a rank, a rank produces clicks, and clicks can be counted. AI search weakens each one.
- Ranking position is unstable or absent. A generated answer may list three brands today and seven tomorrow, in a different order.
- Visibility no longer implies a visit. A brand can be named or cited in an answer that the user reads without clicking. Our article on how AI Overviews are changing SEO and organic traffic in 2026 covers the click data.
- Some of the traffic is hard to identify. Referrals from AI tools are tagged inconsistently, so default reports can undercount them.
That does not make traditional metrics useless. Rankings, impressions, and organic sessions still describe the part of search that works the old way. They are simply no longer enough, so the KPI set needs new layers.
Three Constraints That Shape Every KPI
A KPI is only useful if you can measure it consistently. Three constraints decide which metrics deserve a place on your scorecard.
1. AI answers vary between runs
Search Engine Land and Search Engine Journal reported on a study by Rand Fishkin of SparkToro and Patrick O’Donnell of Gumshoe.ai. As reported, it covered about 3,000 prompts run by hundreds of volunteers across ChatGPT, Claude, and Google’s AI features. For brand recommendation prompts in a dozen categories, each run repeatedly, the authors found that the same list of brands came back less than 1% of the time, and the same list in the same order less than 0.1% of the time. Nearly every response differed in brands, order, or number of items.
The same coverage reported something useful for measurement. Some brands appeared in most responses for a given intent even as their positions shifted. Headphone prompts written by 142 participants were very different from each other, yet the same few major brands recurred in 55% to 77% of the responses. The authors’ practical takeaway was to measure how often a brand appears across many prompts and runs, not its exact position.
There are caveats. Gumshoe.ai sells AI tracking tools, and Fishkin disclosed this. The report is not peer-reviewed, and the authors acknowledged open questions, including how many runs are needed for reliable visibility numbers and whether API calls behave like real user sessions. We read secondary coverage and not the full report, so treat the figures as indicative.
The design lesson is direct: a single answer is an anecdote, and a rate across many answers is a measurement.
2. First-party data is partial
The most trustworthy numbers come from the platforms, and they are limited. Google’s Search Console generative AI performance report, as described in its help documentation, reports impressions for AI Overviews and AI Mode, not clicks. Bing Webmaster Tools introduced an AI Performance report as a public preview in early 2026, reported to cover citations and grounding queries but, per the report’s own description, not clicks or rankings. Check your accounts for the current state, since these reports change.
First-party data is therefore best for exposure on those platforms. It says nothing about ChatGPT, Perplexity, Claude, Gemini’s chatbot, or other tools unless they provide their own reporting.
3. Referral traffic is undercounted
OpenAI documents that ChatGPT adds utm_source=chatgpt.com to links, which helps identification. A July 2026 Search Engine Journal article, based on one author’s review of a single GA4 account, described AI traffic being split across channels, with some landing in Direct. Because of this, your AI referral number should be treated as a floor, not a total.
Together, these constraints point to a scorecard that blends first-party exposure data, sampled visibility rates, and identified outcomes, and that labels which is which.
The Four-Layer KPI Framework
[IMAGE 2: Diagram of the four KPI layers goes here]
Each layer answers one question. A team can move down the layers as its measurement matures.
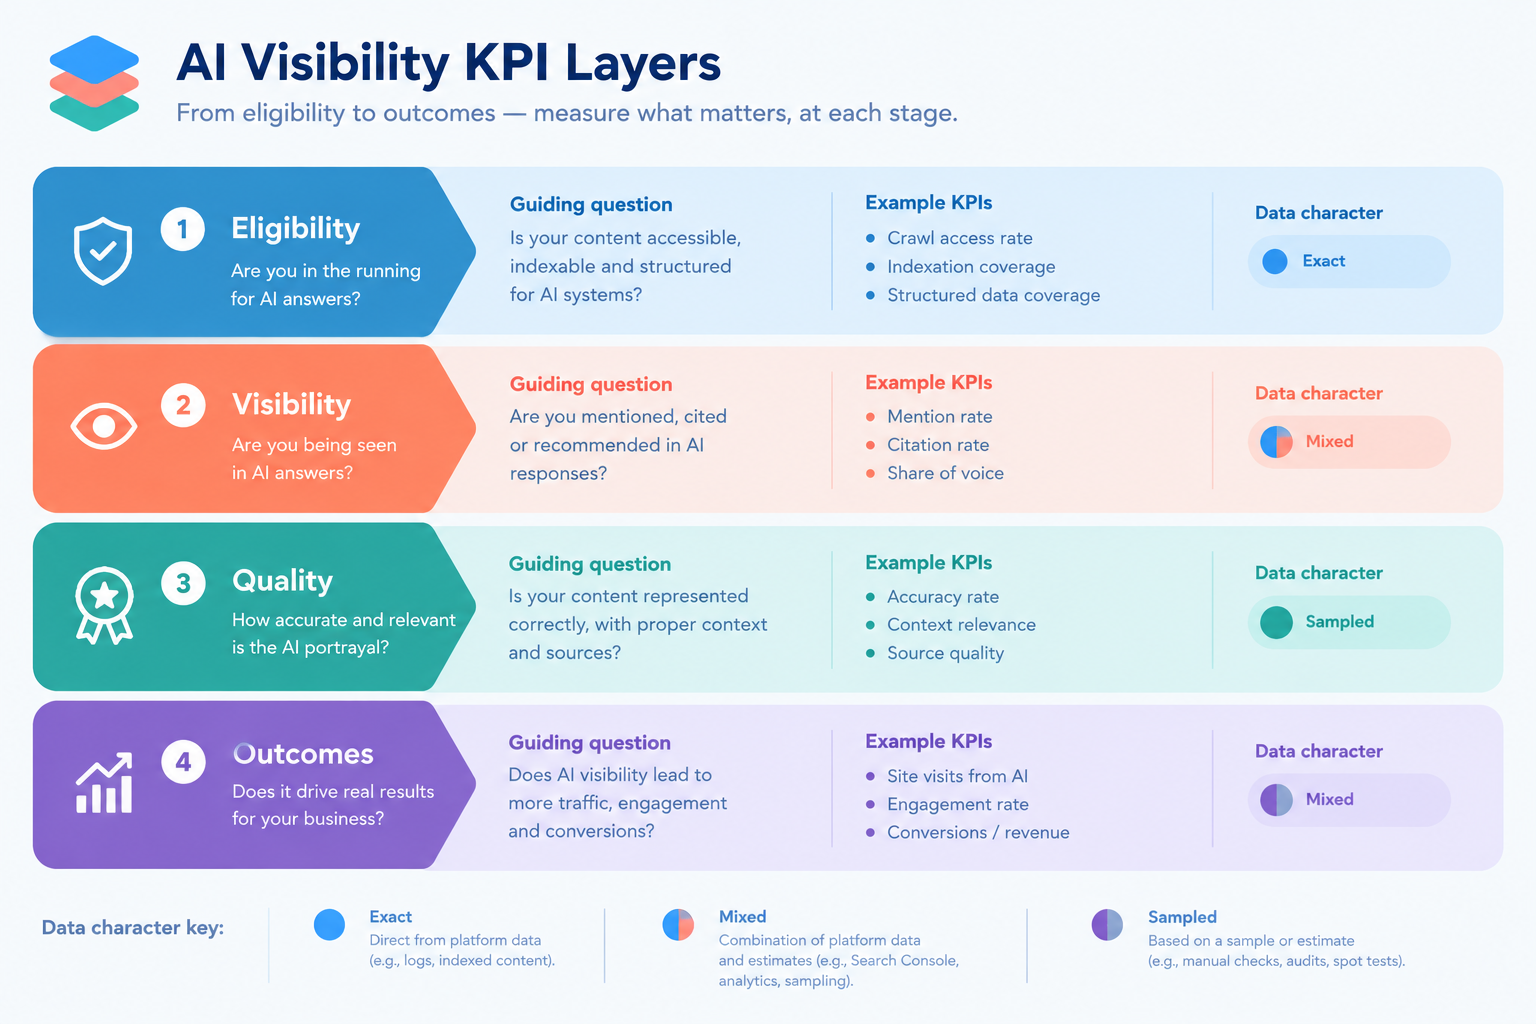
| Layer | Question it answers | Example KPIs | Data character |
|---|---|---|---|
| 1. Eligibility | Can AI systems reach and use our content? | Indexed key pages, crawler access, error rates, snippet eligibility | Exact (your own systems) |
| 2. Visibility | How often do we appear in AI answers? | Impressions in AI features, mention rate, citation rate, share of voice | Mixed: first-party and sampled |
| 3. Quality | Are we described accurately and favorably? | Accuracy rate, recommendation rate, sentiment, source mix | Sampled, with human scoring |
| 4. Outcomes | What does it do for the business? | Identified AI referral sessions, engagement, conversions, branded search demand | Exact but incomplete |
Report all four together. Visibility without quality can mean being mentioned inaccurately. Outcomes without visibility cannot tell you why anything changed. Eligibility without the rest can leave you comfortable while nothing happens.
Layer 1: Eligibility KPIs
These are the least glamorous and the most reliable. If a key page cannot be crawled or indexed, no visibility KPI will move. Google’s documentation says a page must be indexed and eligible to be shown in Search with a snippet to appear in its AI features, and OpenAI says to allow OAI-SearchBot for inclusion in ChatGPT search results. Our guide on optimizing your website for ChatGPT, Gemini and AI search covers the fixes.
| KPI | Definition | Source | Cadence | Caution |
|---|---|---|---|---|
| Priority page index rate | Priority pages indexed divided by priority pages, as a percentage | Search Console indexing data | Monthly | Define the priority list once and version it |
| Crawler access | Share of priority pages reachable by the crawlers you want to allow, per your robots.txt and firewall settings | robots.txt review and server or CDN logs | Monthly | Verify crawler identity before trusting log lines |
| Error rate on priority pages | Priority page requests returning 4xx or 5xx divided by all priority page requests | Server logs | Weekly | Spikes matter more than small drifts |
| Snippet eligibility | Priority pages with no blocking snippet directive | Template and tag audit | Quarterly | Do not remove directives you set on purpose |
Treat Layer 1 as a health check with a target of “no unexplained problems,” not as a performance score to push upward.
Layer 2: Visibility KPIs
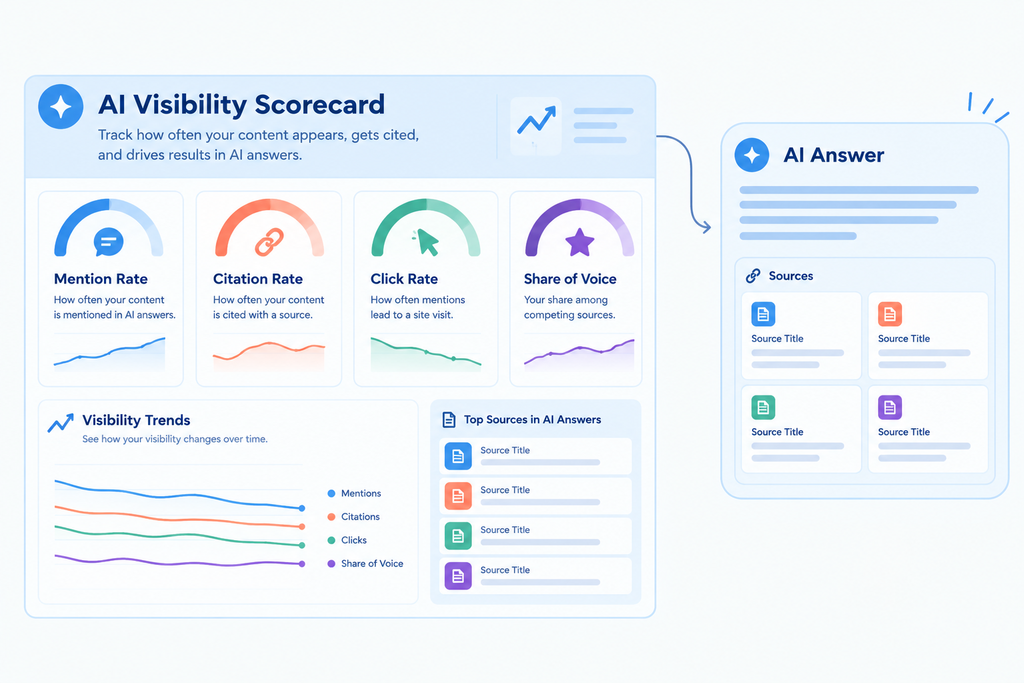
This layer answers the question most people mean by “AI visibility.” It combines first-party exposure data and sampled rates from your own prompt tests.
KPI 1: Generative AI impressions (Google)
Definition: the number of times links to your site were shown in Google’s generative AI features, as reported in the Search Console generative AI performance report. Use: a trend line and a page-level list of what appears. Caution: it counts appearances, not readings or clicks. The help documentation also notes that totals are aggregated differently in charts and tables, so compare like with like.
KPI 2: Bing AI citations
Definition: the citation count shown in Bing Webmaster Tools AI Performance reporting, where available. Use: a trend line and a list of grounding queries for content planning. Caution: it was reported as a preview, covers Microsoft surfaces, and excludes clicks.
KPI 3: Mention rate
Definition: the percentage of tested prompt runs in which your brand is named in the answer. Formula: responses that name your brand divided by total responses tested, multiplied by 100. Use: the broadest visibility measure, and the one most affected by brand strength. Caution: it says nothing about whether the mention is accurate or positive, and it can rise even when citation does not.
KPI 4: Citation rate
Definition: the percentage of tested prompt runs in which a page on your domain appears as a cited source. Formula: responses that cite your domain divided by total responses tested, multiplied by 100. Use: the best measure of whether your content is being used as evidence. Caution: not every tool shows sources, and citations to third-party pages about you do not count as your own citations. Keep them as a separate “earned citation” count.
KPI 5: Share of voice
Definition: your share of all brand mentions across a defined competitor set and prompt set. Formula: your mentions divided by total mentions of you and your named competitors, multiplied by 100. Caution: the number depends entirely on who you include. Adding or removing a competitor changes it without anything changing in the market. Freeze the competitor list, document it, and note any change. A vendor guide we read for definitions, from LLM Pulse, makes the same point and also recommends reporting mentions and citations separately and aggregating counts instead of averaging percentages across platforms. That vendor sells a tool, so treat its recommended sample sizes as its own convention, not a standard.
KPI 6: Visibility by intent cluster
Definition: mention and citation rates calculated separately for groups of prompts that share an intent, such as “best option for a small business,” “alternatives to a named competitor,” or “how do I solve a specific problem.” Why it matters: the SparkToro study coverage found that changing the intent changed the set of brands that appeared. A single blended number hides this. Intent-level rates show where you are present and where you are absent, which is what a content team can act on.
Why not rank position?
Some tools report your “position” in AI answers. Given the variation described above, a single position is unreliable, and the study’s authors argued position tracking is effectively meaningless. If you do track order, report the share of runs in which you appear in the first few mentions, and treat it as a secondary signal. The primary KPI should be how often you appear.
Layer 3: Quality KPIs
Being mentioned is not the same as being represented well. Quality KPIs require a human to read a sample of answers against a scoring rubric. They are slower and more subjective, which is why they are worth defining carefully.
| KPI | Definition | How to score | Caution |
|---|---|---|---|
| Accuracy rate | Mentions where the key facts are correct divided by total mentions | List the facts that must be right (what you sell, where you operate, pricing model, key differentiators). Score each mention pass or fail. | Define the fact list before you test. Re-check facts when your business changes. |
| Recommendation rate | Runs in which you are actively recommended, not just listed, divided by total runs | Use a written rule: for example, named as a suggested option for the stated need versus named only in passing. | Needs a second reviewer on a sample to check consistency. |
| Framing and sentiment | Share of mentions that are positive, neutral, or negative | Three-point scale with written examples of each. | Small samples swing wildly. Report counts alongside percentages. |
| Source mix | Share of answers where your own pages, review sites, forums, press, or competitors supply the supporting sources | Record the domain type of each cited source. | Shows where your reputation is built, not only where your site appears. |
| Misinformation incidents | Count of answers that state something materially false about you | Log each one with the prompt, date, platform, and a screenshot. | Escalate to content, PR, or legal as appropriate. |
Quality KPIs also give you the clearest improvement actions. A wrong fact points to a page to fix or a third-party source to correct. A recommendation gap points to a comparison, evidence, or reputation problem. Our article on getting your brand mentioned in ChatGPT and other AI search engines covers those levers.
Layer 4: Outcome KPIs
Leaders ultimately care about business results. Outcome KPIs are the most persuasive and also the most incomplete, so label them honestly.
| KPI | Definition | Source | Caution |
|---|---|---|---|
| Identified AI referral sessions | Sessions from sources you have classified as AI tools | Analytics with a custom channel or source filter | A floor, not a total, because some visits arrive without a readable source. |
| Engaged sessions from AI sources | Identified AI sessions that meet your engagement definition | Analytics | Compare against organic on the same pages and period. |
| AI-sourced conversions | Leads, sales, calls, or sign-ups attributed to identified AI sessions | Analytics and CRM | Small numbers are volatile. Report counts with rates. |
| Branded search demand | Search impressions and clicks for queries containing your brand | Search Console branded segment | A supporting signal. Many things move brand demand, so avoid claiming causation. |
| Direct and self-reported discovery | Share of new customers who say they found you through an AI tool | Form field or sales conversation note | Self-reports are imperfect, yet they capture influence that analytics misses. |
| Zero-click exposure estimate | AI feature impressions minus identified clicks, shown as a ratio | Search Console and analytics | A rough indicator, since the data sources count differently. |
Seer Interactive’s 2026 update gives a reason to track outcomes alongside visibility. In its data on informational queries during 2025, brands cited in an AI Overview averaged a higher organic click-through rate than brands not cited (2.07% versus 0.94%), though both were below queries with no AI Overview (3.35%). Seer says it cannot claim causation, because higher-authority brands are also more likely to be cited. The finding does show that “visible” can mean different things for clicks, which is why outcomes belong on the same page as visibility.
How to Handle Variance
Because answers vary, a KPI based on prompt tests has noise. Handle it with design, not hope.
Measure your own noise first
Before you trust a trend, run the same prompt set several times on the same day and compare the mention and citation rates. The spread between those runs is your noise floor. A monthly change smaller than that spread is not evidence of anything. The SparkToro study coverage left open how many runs are enough, so do not copy a number from a vendor. Test your own.
Use many prompts and repeat them
Build a prompt set that mixes branded, category, comparison, and problem-solving queries, and weight it toward what your customers actually ask. Use sales calls, support tickets, and Search Console queries as sources. Run each prompt more than once, and record the date, platform, and settings. More prompts and repeats reduce noise, at the cost of time or tool fees.
Report ranges and trends
Show a rate with a range, such as “mention rate was between X% and Y% across repeated runs,” and show the direction over several months. Avoid reporting a single week’s value as if it were precise.
Keep the test stable
Freeze the prompt list, competitor set, and scoring rubric for a reporting period. If you change them, start a new baseline, or run the old and new sets side by side for one period so the series stays comparable.
Do not average across platforms
Different platforms behave differently. Report each separately, and if you need a blended figure, add up the counts and divide by total runs instead of averaging percentages.
Setting Baselines and Targets
There is no universal “good” mention rate or citation rate. Results depend on your market, prompt set, platforms, and competitors, so a number quoted from a blog post will not transfer. Use these approaches instead.
Baseline against yourself
Run your prompt set for at least a few cycles before setting any target. Use the average and the spread as your baseline.
Benchmark against a defined peer set
Test three to five named competitors on the same prompts. Relative position in the set is more meaningful than an absolute score, although it inherits the competitor-list caution above.
Set targets as ranges tied to actions
A target such as “raise citation rate on comparison prompts from the baseline range to a higher range by next quarter, by publishing three evidence-based comparison pages” is testable. A target such as “reach 50% share of voice” is not, unless the baseline supports it. Targets should be changed only when the underlying measurement changes.
Template
| Field | Example wording (fill in with your own data) |
|---|---|
| KPI | Citation rate on comparison prompts |
| Baseline | [Range from your first three test cycles] |
| Target | [Higher range, with the date] |
| Action | [Pages to publish or improve] |
| Noise floor | [Spread between repeat runs] |
| Owner | [Name or team] |
| Review date | [Date] |
Choosing KPIs by Maturity
You do not need every KPI at once. This table is a judgment-based starting point.
| Stage | Suggested KPI set | Why |
|---|---|---|
| Just starting | Priority page index rate, Search Console AI impressions, mention rate and citation rate on a small prompt set, identified AI referral sessions | Low cost, mostly first-party, enough to find the basics |
| Established | Add intent-level visibility, accuracy rate, branded search demand, AI-sourced conversions | Shows where you are strong and whether it matters |
| Advanced | Add share of voice against a frozen peer set, recommendation rate, source mix, misinformation log, self-reported discovery | Supports competitive and reputation decisions |
| Agency or multi-brand | Standardize definitions, rubrics, and reporting across clients, and keep a change log | Comparable reports and defensible methods |
By business type
| Business type | KPIs to emphasize (judgment) |
|---|---|
| Local service business | Accuracy rate for hours, services, and location. Mention rate on “near me” and problem prompts. Business profile data accuracy. |
| Ecommerce | Citation rate on product comparison prompts. Accuracy of product facts. AI-sourced conversions. |
| B2B software | Share of voice on category and alternatives prompts. Recommendation rate. Source mix (reviews and comparison sites). |
| Publisher or creator | Citation rate by topic cluster. AI feature impressions by page. Referral engagement. |
| Agency or consultancy | Mention rate on “best provider” prompts. Quality of framing. Self-reported discovery. |
Building the Scorecard and Report
A good report is short, honest, and tied to decisions. A one-page scorecard works for most teams. Our tracking article describes the dashboard setup, so this section covers the structure of what leaders should see.
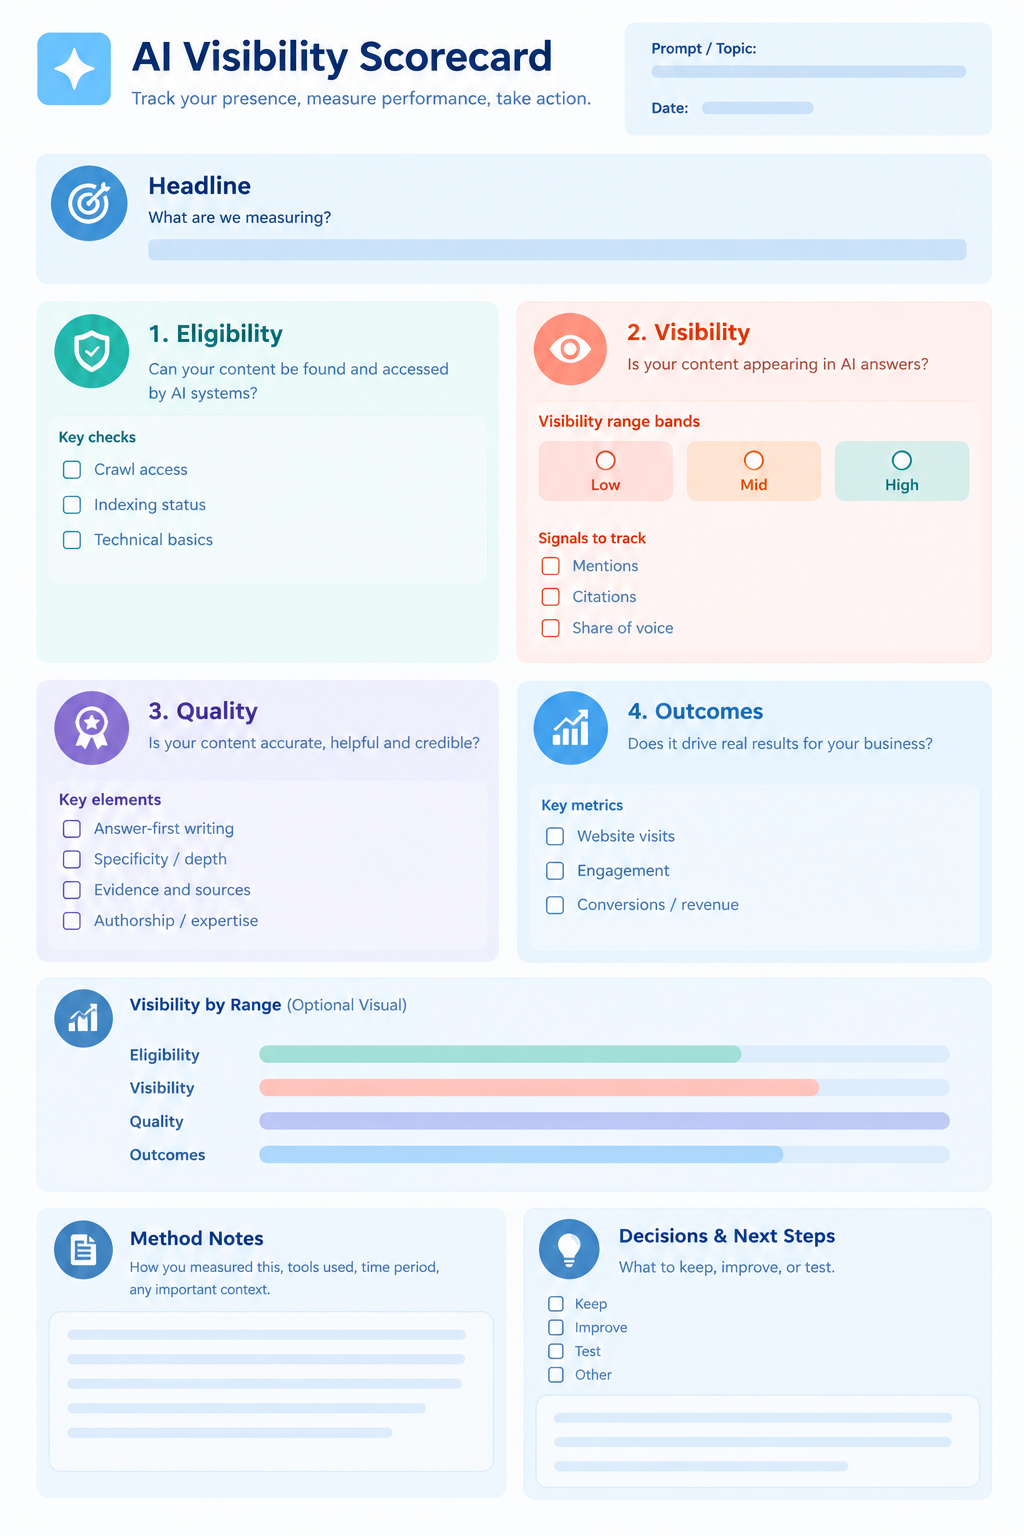
A one-page layout
| Section | Contents | Format |
|---|---|---|
| Headline | Three sentences: what changed, why we think so, what we will do | Plain text |
| Eligibility | Priority page index rate and crawl or error flags | Status lights with a short note |
| Visibility | Search Console AI impressions, mention rate, citation rate, share of voice, with ranges | Trend lines with a noise band |
| Quality | Accuracy rate, recommendation rate, incidents | Counts and short examples |
| Outcomes | Identified AI sessions, conversions, branded demand, self-reported discovery | Trend lines, labeled as a floor where relevant |
| Method notes | Prompt count, runs, platforms, competitor set, changes since last report | Small print, always included |
| Decisions | Actions taken and planned, with owners | Short list |
Cadence
- Weekly (operations): error rates, index issues, any new misinformation incident.
- Monthly (marketing): the full scorecard, with comparisons against the baseline range.
- Quarterly (leadership): trends, competitive position, outcomes, and the plan for the next quarter.
How to talk to leaders
Lead with outcomes and decisions, then show the visibility data as the explanation. Say plainly what is measured and what is sampled. A sentence like “These rates come from repeated tests and vary by run, so we report ranges” builds credibility, and it prevents a bad week from turning into a crisis.
Vanity Metrics and Misreads
| Metric or habit | Why it misleads | Better approach |
|---|---|---|
| One screenshot of an answer | It is one sample from a variable process | Rate across many prompts and runs |
| Single-run rank position | Position changes between runs | Share of runs where you appear |
| Total mentions without context | Counts can include inaccurate or negative mentions | Pair with accuracy and framing |
| Blended share of voice across platforms | Hides platform differences and depends on the competitor list | Per platform, with a frozen peer set |
| AI referral sessions as the whole story | Undercounts, and ignores no-click exposure | Add impressions, branded demand, and self-reports |
| Comparing to a generic benchmark | No universal benchmark exists | Baseline against yourself and a defined peer set |
| Changing the prompt list mid-year | Breaks comparability | Version the list and overlap periods |
Linking KPIs to Business Value
It is tempting to promise that rising visibility produces revenue. The evidence for a direct link is thin, and the honest approach is to build a case from several signals.
- Show the visibility trend with ranges and method notes.
- Show the outcome trend for identified AI sessions, conversions, and branded demand over the same period.
- Add qualitative evidence, such as sales notes and form responses that mention AI tools.
- Annotate actions, such as page rewrites and new content, so changes can be linked to causes or ruled out.
- State the limits, including that correlation is not proof and that some influence is invisible to analytics.
This does not give a precise return on investment figure, and it should not be presented as one. It gives a reasoned case that a leader can weigh.
Common Mistakes
- Tracking too many KPIs. Start with a handful you can defend.
- Choosing KPIs because a tool offers them. Choose the question first, then the metric.
- Ignoring variance. Measure your noise floor and report ranges.
- Changing the method silently. Version prompt lists, competitor sets, and rubrics.
- Counting mentions as wins. Check accuracy and framing.
- Reporting only AI traffic. Much of the exposure never produces a visit.
- Using vendor benchmarks as targets. No universal benchmark exists.
- Promising results. No tactic can guarantee citations, mentions, or rankings.
A 60-Day Rollout Plan
Days 1 to 30: Define and baseline
- Write the questions leadership needs answered, and pick KPIs from each layer.
- Define the priority page list, the competitor set, and the scoring rubric.
- Build a prompt set from real customer questions.
- Open the Search Console and Bing reports, and set up AI source tracking in analytics using the steps in the tracking article.
- Run the prompt set several times and record the noise floor.
Days 31 to 60: Report and act
Publish the first scorecard with method notes and ranges. Pick two or three actions based on the quality and visibility gaps, such as fixing an inaccurate page or building a comparison page. Record the dates. Re-run the same tests at the end of the period, compare against the baseline range, and update the plan. Repeat monthly, and review the KPI set quarterly.
Worked Example (Illustrative)
This is a hypothetical scenario, not a case study, and its numbers are invented to show how to read the KPIs. A regional project management software company tests 40 prompts across three AI platforms, with each prompt run several times. In the first cycle, its mention rate sits in a range that overlaps strongly with two competitors. Its citation rate is much lower than its mention rate, and an accuracy review finds that several answers describe an older pricing model.
The team reads this as follows. Brand awareness is adequate, but its own pages are rarely used as evidence, and one important page is out of date. The actions are to update the pricing page, publish a transparent comparison with a documented method, and correct two third-party listings. Next cycle, the team looks for a change in accuracy and in comparison-prompt citation rate beyond its noise floor. It also checks identified AI sessions and branded searches, and it reports them with ranges. If the changes fall within the noise, the team says so and keeps testing instead of claiming a win.
What These KPIs Cannot Tell You
- Why a specific answer named or ignored you. Platforms do not publish full selection logic.
- Your total AI influence. Some of it appears as direct visits, branded searches, or private conversations you never see.
- Whether sampled prompts represent real user behavior. Your prompt set is a model of demand, not demand itself.
- Whether API-based tests match what people see in the apps. This was raised as an open question in the study coverage.
- Future behavior. Platforms, models, and reports change, so definitions and tools need periodic review.
Frequently Asked Questions
What are the most important AI search visibility KPIs?
A practical core set is priority page index rate, Search Console generative AI impressions, mention rate, citation rate, accuracy rate, identified AI referral sessions, and branded search demand. Add share of voice and intent-level visibility as your measurement matures.
What is AI share of voice?
It is your share of all brand mentions across a defined competitor set and prompt set. The result depends on who you include, so freeze and document the competitor list. It tracks visibility and does not by itself predict revenue.
What is a good mention rate or citation rate?
There is no universal benchmark. Results depend on your market, prompts, platforms, and competitors. Baseline against your own repeated tests and a defined peer set, and set targets as ranges tied to specific actions.
How many prompts and runs do I need?
No settled answer exists, and the research coverage we read listed it as an open question. Start with a prompt set drawn from real customer questions, repeat each prompt, measure the spread between repeat runs, and increase volume until that noise is small enough for your decisions.
Should I track my ranking position in AI answers?
Treat position as a weak signal at best. Research coverage reported that lists repeat rarely and order almost never repeats. Track how often you appear, and use the share of runs in which you appear early as a secondary indicator.
Can Search Console tell me my AI visibility?
Partly. For Google’s AI Overviews and AI Mode, Google’s generative AI performance report shows impressions. It does not cover other platforms, and it does not show whether answers were accurate. Check your account for the metrics it currently offers.
How do I connect AI visibility to revenue?
Build a case from several signals: visibility trends with ranges, identified AI sessions and conversions, branded search demand, and self-reported discovery, with dated actions. This supports a reasoned argument, and it does not prove a precise return.
How often should I report AI search KPIs?
Monitor operational issues weekly, publish a full scorecard monthly, and review strategy quarterly. Weekly visibility numbers from small samples are usually noise, so reserve them for alerts.
Conclusion
Measuring AI search visibility is less about finding one perfect number than about building a scorecard you can defend. Group your KPIs into eligibility, visibility, quality, and outcomes. Report visibility as rates across many prompts, show ranges instead of single points, label what is exact and what is sampled, and tie every metric to a decision.
Start small. Pick a handful of KPIs, build a prompt set from real customer questions, measure your own noise, and publish a one-page scorecard with method notes. Then improve it each quarter. A modest, honest measurement system will serve you better than a large dashboard nobody trusts.
Next step: Read our complete guide to generative engine optimization