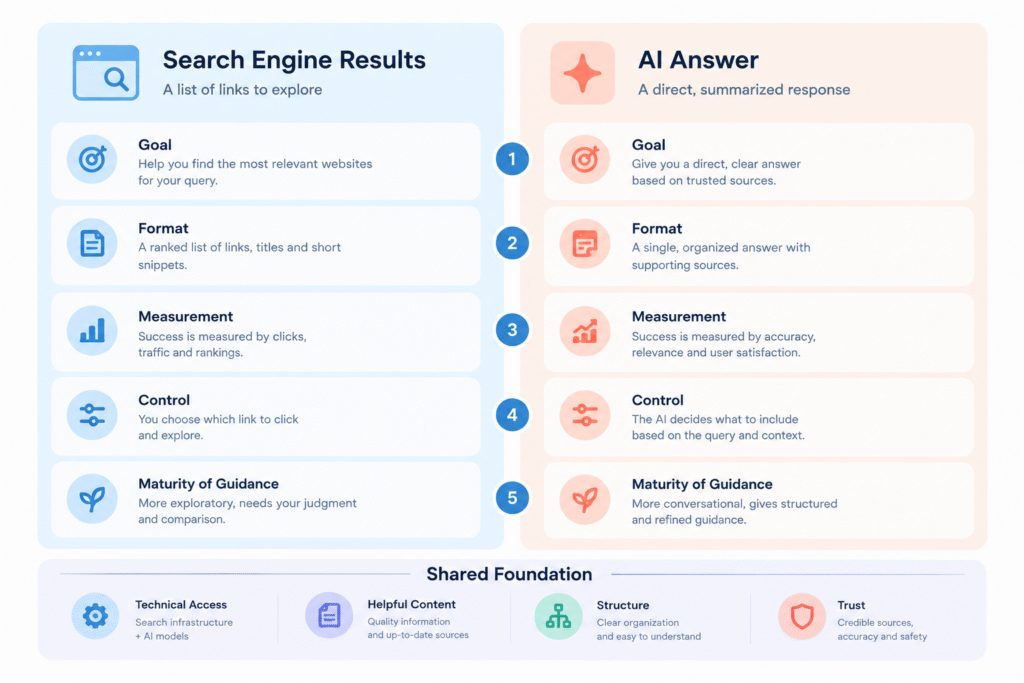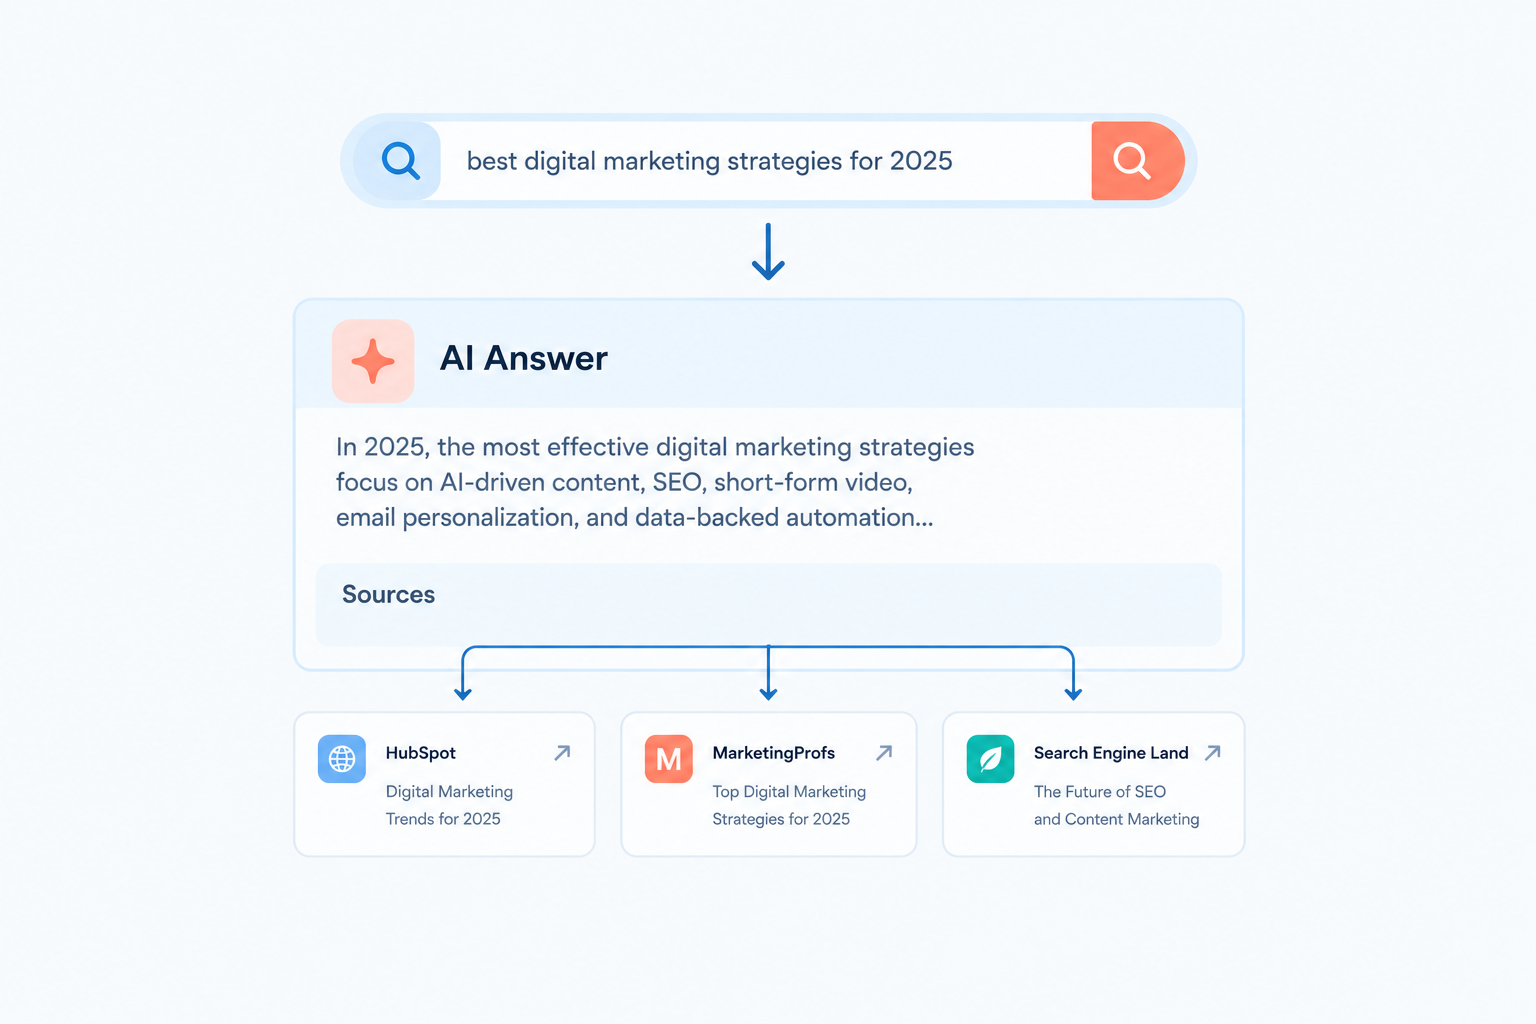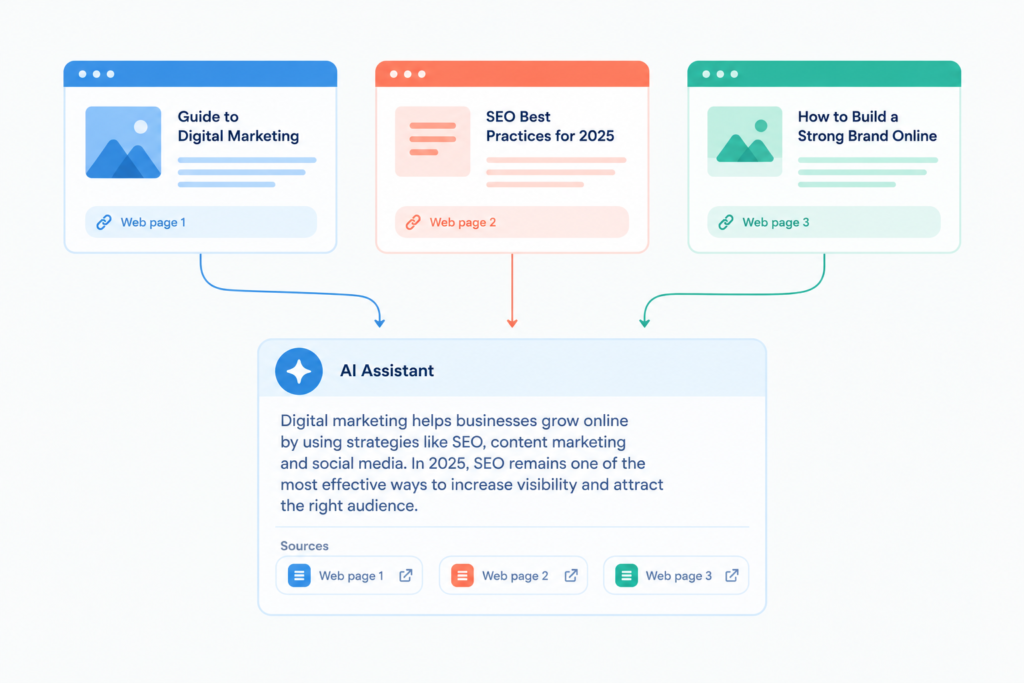

If your organic traffic has softened over the past year, you have probably been told that AI Overviews are the reason. Sometimes that is right. Sometimes it is only part of the story, and sometimes it is not the story at all. The studies on this topic are real and worth taking seriously, but they measure different things in different ways, and none of them is your website.
This guide looks at what the main studies found, why their numbers disagree, what Google itself says about AI Overviews and SEO, and how to work out your own exposure. It then lays out a practical response. The goal is a clear view of AI Overviews SEO in 2026 without hype in either direction.
AI Overviews appear to reduce clicks on the pages they appear above, and the effect is largest for informational queries. Independent studies report drops in click-through rate ranging from roughly one third to well over half, depending on method. Google says there are no extra requirements to appear in them and that standard SEO still applies. The practical response is to measure your own exposure by query type, protect your strongest pages, and shift goals from clicks alone to clicks, citations, and brand demand.
Read more on What Is Generative Engine Optimization (GEO)? A Complete Guide
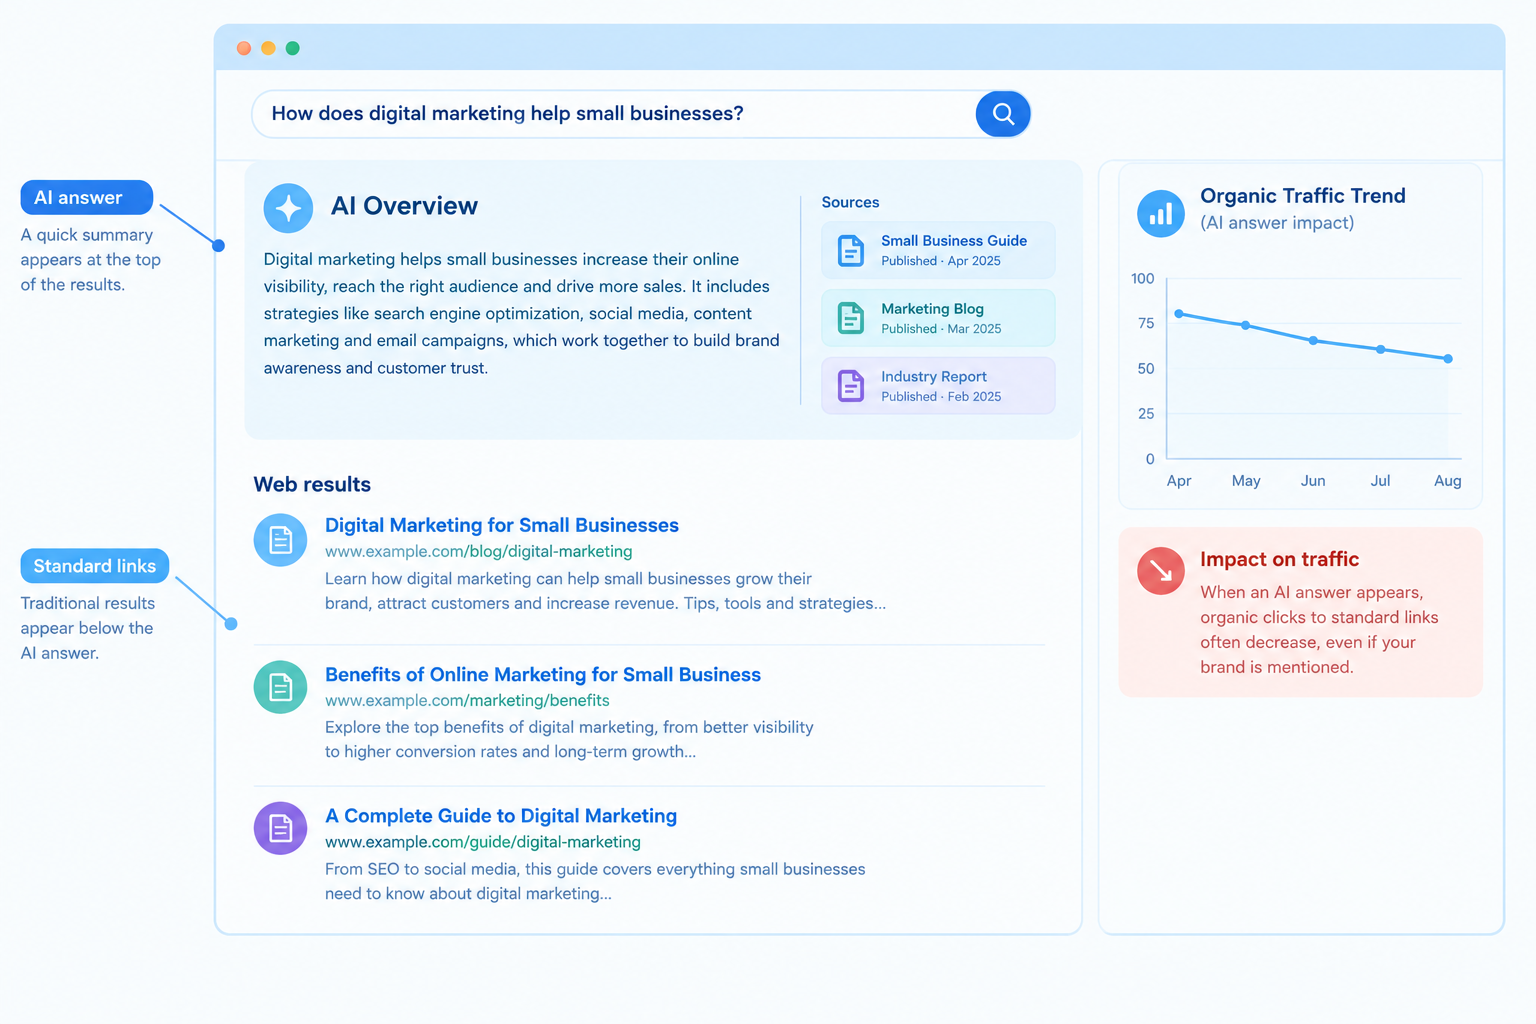
What AI Overviews Are, in Google’s Words
Google’s documentation describes AI Overviews and AI Mode as features that generate a response and show supporting links to web pages. It says AI Overviews appear only when Google’s systems judge them helpful beyond what classic Search provides, which is why many queries never show one. Both features use a technique Google calls query fan-out, which runs several related searches across subtopics and data sources while building a response. As a result, they can show a wider and more varied set of links than a classic results page.
Two points from the same documentation matter for the rest of this article. First, to be shown as a supporting link, a page must be indexed and eligible to appear in Search with a snippet, and Google says there are no additional requirements. Second, sites appearing in AI Overviews and AI Mode are included in the Search Console Performance report under the Web search type. In other words, the data lives inside the numbers you already look at, which makes it easy to misread.
[IMAGE 2: Diagram of the click funnel with and without an AI Overview goes here]
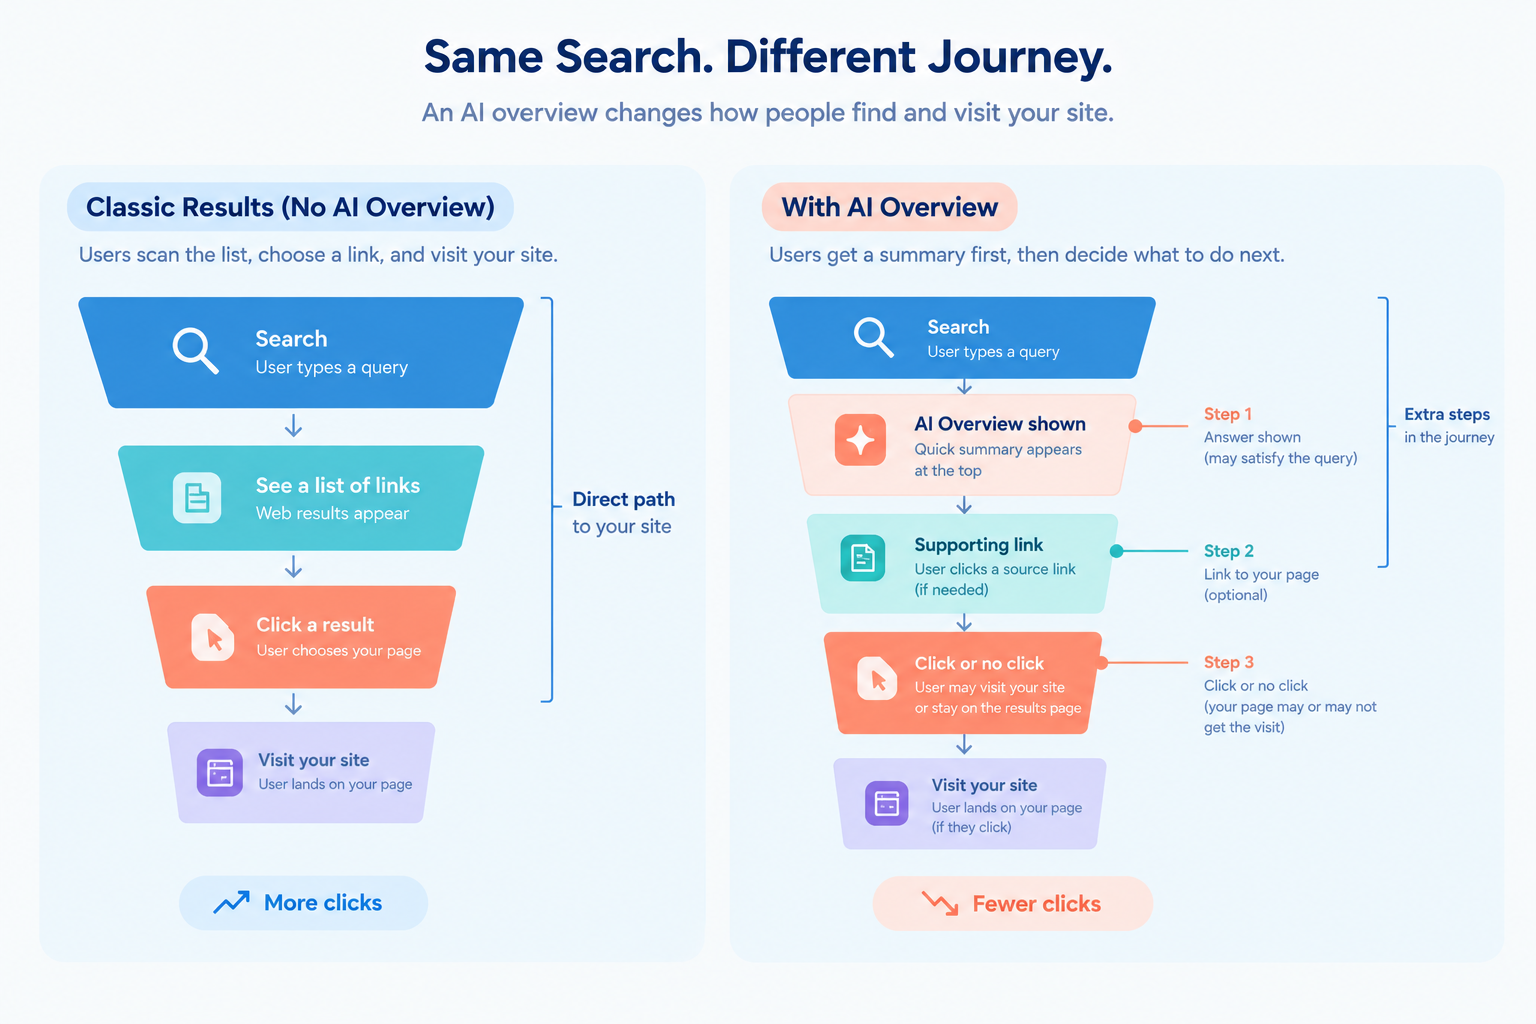
What the Main Studies Found
No single study settles this question. The table below summarizes the ones read for this article, along with the data they used. Treat each as a measurement of a particular sample, not a universal rate.
| Study | Data and period | Reported finding | Main limits |
|---|---|---|---|
| Ahrefs (update) | About 300,000 keywords, Search Console data, desktop only, December 2023 versus December 2025 | Position 1 CTR about 58% lower when an AI Overview is present, based on a forecast of what CTR would have been without it. An earlier Ahrefs study (March 2024 versus March 2025) reported 34.5%. | Correlational. Desktop only. One month per year. Groups defined differently across years. No significance testing reported. |
| Seer Interactive | 53 brand accounts, about 5.5 million queries, Search Console data, January 2025 to February 2026 | Organic CTR on queries with an AI Overview fell from 3.19% in January 2025 to 1.31% in December 2025, then recovered to 2.36% in February 2026. Queries without one stayed between roughly 2.4% and 3.9%. | Authors say they cannot claim causation. Brand-account sample. AI Overview status is a retrospective label from one SERP snapshot. |
| Advanced Web Ranking | Tracked US SERPs, over 1.75 million per month, July 2026 snapshot | Desktop position 1 CTR about 9.69% on AI Overview SERPs versus 20.02% across all SERPs. AI Overviews on about 43% of sampled desktop SERPs. | Estimates from tracked SERPs, not Search Console. The page shows large month to month swings, so single snapshots should be handled with care. |
| Pew Research Center | Panel of about 900 US adults and about 68,900 real searches, March 2025 | Reported that users clicked a traditional result on about 8% of visits with an AI summary versus about 15% without. (Secondary report. Pew page not opened.) | US panel, one month, searches by volunteers. Figures here come from a secondary source and need checking against Pew. |
How to read these numbers
- The direction is consistent. The size is not. Every study above finds lower click-through where an AI Overview shows. Estimates of the drop range widely because they use different samples, devices, periods, and baselines.
- Most are correlations. Both Ahrefs and Seer say so. Queries that trigger AI Overviews differ from queries that do not, so a gap in CTR is not purely the effect of the feature.
- Citation appears to matter. In Seer’s data on informational queries during 2025, brands that were cited in an AI Overview averaged 2.07% organic CTR, compared with 0.94% when not cited and 3.35% with no AI Overview. Seer warns that higher-authority brands are also more likely to be cited, so this is not proof that citation causes the difference. It also notes one large account pulled the not-cited figure down.
- Results move. Seer’s data shows CTR on AI Overview queries falling through 2025 and partly recovering in early 2026. A study from one season may not describe the next.
Why the Numbers Disagree
If you have seen headlines claiming anything from a third to more than half of clicks lost, they may all be accurate for their own samples. Differences usually come from these choices.
| Method choice | Why it changes the result |
|---|---|
| Data source | Search Console data reflects real clicks on specific sites. SERP tracking tools estimate clicks from modeled CTR curves. Panel studies observe real users but a small, specific group. |
| Device | Ahrefs used desktop only. Mobile layouts differ and AI Overviews take up more of the screen, so effects may not match. |
| Query set | AI Overviews trigger far more on informational questions than on navigational or branded queries. A sample heavy in informational queries will show larger losses. |
| Baseline | Comparing before and after, with and without, or against a forecast gives different answers, and all of them are influenced by other SERP changes. |
| Time window | Google changes how often and where AI Overviews appear. A single month can be an outlier. |
| Position | Some studies report position 1 only. Others average across the page. Ahrefs reports smaller effects at lower positions. |
| Site mix | A sample of 53 brand accounts is not the same as a sample of small local businesses or publishers. |
The practical lesson is to avoid quoting one headline number to your boss or client. A better sentence is: “Studies using different methods consistently report lower click-through where an AI Overview appears, with estimates varying widely. Here is what our own data shows.”
What Is Changing in SEO
The studies are about clicks. The strategic changes go beyond clicks. These are the shifts that seem best supported, along with where the evidence ends.
1. Informational queries are most exposed
AI Overviews tend to answer questions, definitions, and how-to queries, which is where the studies report the clearest losses. Seer’s informational query data for 2025 shows much lower CTR when an AI Overview appeared. If a large share of your traffic comes from simple “what is” and quick-answer content, that segment is the one to watch first. Content that needs a human decision, a tool, a purchase, or a local visit is generally less replaceable by a summary, although this is a reasonable inference rather than a measured rule.
2. Rankings and traffic have separated
Ranking first used to imply a steady flow of clicks. That link has weakened on queries with an AI Overview. Ahrefs reports position 1 CTR falling on AI Overview keywords from 0.073 to 0.016 between December 2023 and December 2025. That does not mean rankings stopped mattering, since pages must still be indexed and eligible to appear in these features. It means rank is a weaker predictor of traffic than it was, so a rank tracker alone is no longer enough.
3. Impressions can rise while clicks fall
Because AI feature impressions are counted in the same performance totals, a page can appear more often while receiving fewer clicks per appearance. Google has begun rolling out dedicated generative AI performance reports in Search Console, reported to include impressions, pages, countries, devices, and dates for AI Overviews and AI Mode, with the data already part of the overall totals. According to the report read for this article, clicks and click-through rate were not among the described metrics, and rollout began with a subset of sites. Confirm what your own Search Console account shows.
4. Zero-click behavior is rising
Advanced Web Ranking’s July 2026 snapshot reported a higher share of tracked SERPs with no organic click when an AI Overview was present (about 74% versus about 54% without). Pew’s panel study found a similar pattern in users’ behavior. Both are estimates from specific samples, but the direction fits the other studies. For many queries, the audience still sees your brand or an answer without visiting your site.
5. Citations and brand visibility become part of the goal
If the answer is shown on the results page, being cited in it becomes valuable in its own right, both for the click that remains and for brand recognition. Seer’s data suggests cited brands fared better than uncited ones, with the causation caveat above. This is why visibility measurement now needs more than a traffic chart. Our guide to tracking your website visibility in AI search.
6. Paid results are affected too
Seer’s data also reports lower paid click-through on queries with AI Overviews, for example 16.21% versus 21.85% in February 2026. If you run both channels, plan for the effect on both.
What Google Says About SEO in This Environment
Google’s position, as stated in its documentation, is that there are no additional requirements to appear in AI Overviews or AI Mode, and that SEO best practices continue to apply. Its recommendations include:
- Allow crawling in robots.txt and through any CDN or hosting layer.
- Use internal links so content is easy to find.
- Provide a good page experience.
- Keep important content in text form.
- Support text with quality images and videos where relevant.
- Make structured data match the visible text.
- Keep Merchant Center and Business Profile information current.
The same documentation says you do not need new machine-readable files, AI-specific text files, or special schema.org markup. It also describes controls for limiting what appears: nosnippet, data-nosnippet, max-snippet, and noindex, plus Google-Extended for limiting use in some other Google AI systems. These are trade-offs, not fixes. Limiting snippets can reduce how often a page appears at all.
Google also states that clicks from pages in AI Overviews tend to be higher quality, with users more likely to spend more time on the site. That is Google’s own statement. The studies above measure click volume, not visit quality, so you should test the claim in your own analytics instead of assuming either way.
How to Diagnose Your Own Traffic
Before changing strategy, find out whether AI Overviews explain your decline. Traffic falls for many reasons: seasonality, ranking changes, algorithm updates, lost links, technical faults, broken tracking, or changes in demand. This workflow helps separate them.
Step 1: Confirm the drop is real
Compare the same period year over year to remove seasonality. Check that analytics tags fire on all templates, and compare Search Console clicks with analytics sessions. If the two disagree, fix measurement first.
Step 2: Split clicks, impressions, CTR, and position
In Search Console, compare two equal periods. Use this pattern to interpret what you see:
| Pattern | Likely reading | Next check |
|---|---|---|
| Impressions flat or up, clicks down, position stable | Fewer clicks per appearance, consistent with SERP changes such as AI Overviews, featured results, or other features | Look at which queries lost CTR and check the live results |
| Impressions down, position down | Ranking loss | Check updates, competitors, technical issues, lost links |
| Impressions down, position stable | Lower demand, seasonality, or fewer queries triggering results | Check trends for the topic and the query list |
| Clicks down only on branded or only on non-branded queries | Different causes. Branded declines point to brand demand or tracking. Non-branded points to SEO or SERP changes | Segment by branded and non-branded |
Step 3: Segment by query type
Export queries and label them: informational, commercial, transactional, navigational, and branded. Compare CTR change by group. If informational queries explain most of the loss and the others are steady, that is consistent with the pattern in the studies. A uniform decline across all groups points elsewhere.
Step 4: Check the live results
For your top 20 declining queries, search them yourself in a clean browser and note whether an AI Overview appears, whether your page is among the links, and what else appears (local pack, shopping, videos, forum results). Results vary by user and location, so treat this as a sample. Record dates and screenshots.
Step 5: Check the pages
Group lost clicks by landing page. Pages that answer one simple question are most exposed. Pages with a tool, a calculator, a comparison, a template, or an original dataset may hold up better. Mark which category each declining page falls into.
Step 6: Check conversions, not only visits
If lost traffic was mostly early-stage informational visits that rarely converted, the business impact may be smaller than the traffic chart suggests. Compare leads, sales, calls, or sign-ups from organic for the same periods. Use the numbers you can verify, and avoid assuming either that all lost clicks mattered or that none did.
Step 7: Write the diagnosis down
Summarize in a few lines: how much traffic changed, where, which query types, how much is plausibly AI Overview related, what else changed, and what is uncertain. This becomes the basis for decisions and for reporting to stakeholders.
[IMAGE 3: Diagnostic flowchart goes here, or place it at the start of this section]
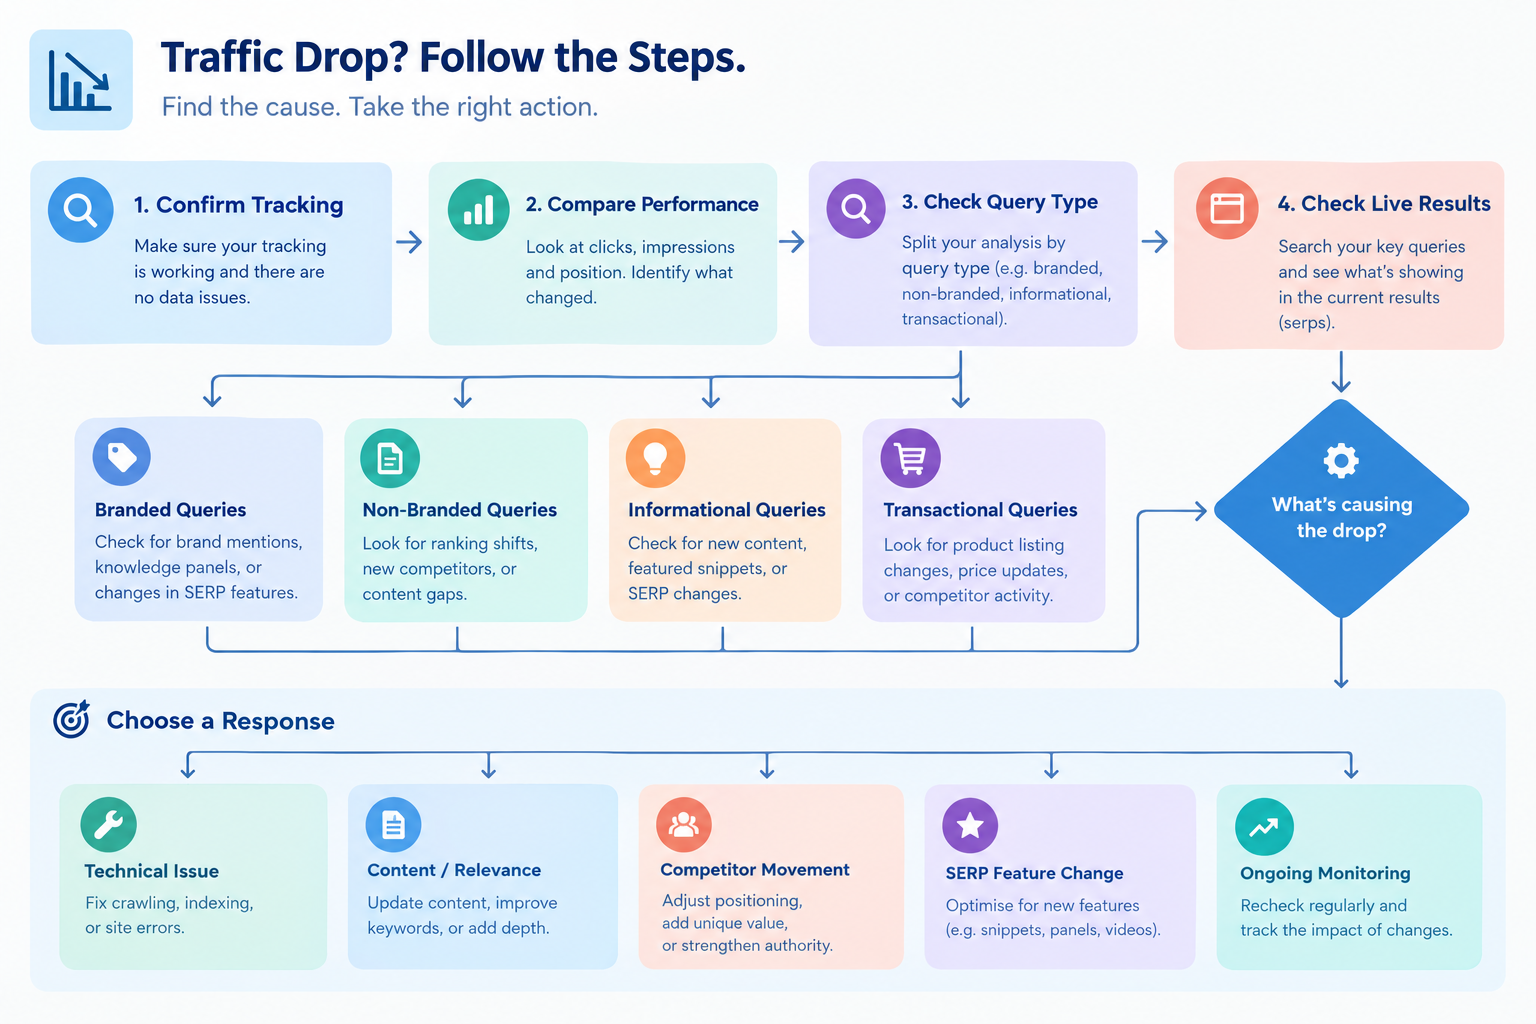
A Practical Response Plan
None of the actions below guarantees traffic, citations, or rankings. They are reasonable responses to the pattern the studies describe.
Protect the pages that earn the most
Start with the pages that drive leads or revenue, not those with the most traffic. Make sure they are indexed, fast, accurate, and clear about who stands behind them. Update real facts, prices, and processes. Avoid changing dates without substantive changes, which Google lists as a warning sign in its helpful content guidance.
Rebalance the content mix
Review informational content that only restates common knowledge. Google describes this as commodity content, and an AI summary can reproduce it without sending anyone to your site. For each page, decide whether to improve it with original material, merge it with a stronger page, keep it as a supporting reference, or retire it. The table below is a judgment-based starting point, not a measured rule.
| Content type | Exposure to AI Overviews (judgment) | Suggested response |
|---|---|---|
| Simple definitions and quick facts | Higher | Keep concise, add what only you know, link to deeper pages, and do not expect high click volume |
| How-to and troubleshooting | Moderate to higher | Add real examples, screenshots, tools, templates, and failure cases |
| Comparisons and buying guides | Moderate | Add original testing, clear criteria, pricing and transparent methodology |
| Original research and data | Lower for the click, higher for citation | Publish methods and dates, and make findings easy to cite |
| Tools, calculators, templates | Lower | Maintain and promote them, since a summary cannot fully replace the tool |
| Local and service pages | Varies | Keep business profile data accurate, add real photos, reviews, and service details |
| Branded and navigational pages | Lower | Keep them clear and fast so brand searches convert |
Write for the passage as well as the page
Because these systems build answers from specific sources, clarity at the passage level helps. Open sections with a direct answer, state facts with their source and date, and say what you did and how. Our guide on creating content that gets cited by AI search engines explains the workflow in detail. Google says you do not need to rewrite for AI or chunk content, so use this as good writing practice, not a trick.
Build demand that does not depend on the click
If more answers are delivered on the results page, brand recognition matters more. People who already know your name search for it, click your result, and are less affected by summaries of generic queries. Useful channels include email, community, partnerships, original research, speaking, and a strong reputation across the web. Our guide on getting your brand mentioned in ChatGPT and other AI search engines covers this side.
Update measurement and reporting
A report that shows only sessions and rankings will tell a confusing story. Add the metrics below, and be clear about which are exact and which are estimates.
| Metric | Where to get it | Caveat |
|---|---|---|
| Clicks, impressions, CTR, position by query group | Search Console Performance report | AI feature data is included in the totals. Check whether you have the dedicated generative AI report |
| Generative AI impressions and pages | Search Console generative AI report, where available | Reported to be rolling out to a subset of sites. Clicks may not be included |
| Branded search demand | Search Console branded query segment | Requires a branded term list |
| AI referral visits | Analytics referral and source reports | Undercounts, because some referrals lack source data |
| Prompt audit results (citation and mention) | Manual sample you run on a schedule | Answers vary. Track trends over time, not single results |
| Conversions from organic | Analytics and CRM | The most important check on business impact |
Reset expectations
If you forecast organic traffic, avoid straight-line projections from last year’s growth. Build ranges, document assumptions, and revisit them quarterly. Seer’s own forecasts, for instance, are described as directional floors, not predictions. Tell stakeholders that studies disagree and that the aim is to measure your own exposure.
A 90-Day Plan
This plan assumes a small team and no new tools. Adjust it to your resources.
Days 1 to 30: Diagnose
- Compare Search Console clicks, impressions, CTR, and position year over year.
- Segment queries by type and by branded versus non-branded.
- Check live results for your top declining queries and record what you see.
- Check whether the generative AI report is available in your Search Console account.
- Write the diagnosis summary.
Days 31 to 60: Prioritize and fix
- Rank pages by business value and by exposure.
- Verify that top pages are crawlable, indexed, and accurate.
- Improve three to five high-value pages with original evidence, a clearer opening answer, and a visible author and update note.
- Decide what to do with thin informational pages: improve, merge, or retire.
Days 61 to 90: Measure and adjust
Re-run the same checks on the improved pages. Compare against the earlier period, and note what else changed in the meantime. Update the report format so leaders see clicks, visibility, branded demand, and conversions together. Then repeat the cycle quarterly.
Worked Example (Illustrative)
This is a hypothetical scenario, not a case study. A regional accounting firm sees organic clicks fall 25% year over year. Search Console shows impressions roughly flat, with position stable. Splitting queries, the firm finds that most of the loss sits on simple tax definition queries, while queries about local services and its calculator pages are steady. Checking live results, it sees that an AI Overview appears on several of the definition queries and that its page is not among the links.
Conclusion: the pattern fits reduced click-through on informational queries, though the firm cannot prove causation. Conversions from organic are unchanged, because the lost visits were mostly early-stage readers. The response is to leave the definition pages concise, add worked examples and a named accountant’s review to the top few, invest in the calculators and local pages, and report conversions and branded searches alongside clicks. Nothing in this plan promises that the AI Overview will cite the firm.
Common Mistakes
- Quoting one headline figure. Studies disagree for good reasons. Use your own data and show the range.
- Blaming AI Overviews for everything. Check seasonality, rankings, technical faults, and tracking first.
- Abandoning SEO. Google says SEO best practices continue to apply, and pages must still be indexed and eligible to appear.
- Chasing special files or markup. Google says none are required for these features.
- Blocking snippets to protect traffic without testing. This can reduce visibility and may not recover clicks.
- Publishing unreviewed AI-generated pages at scale. Google’s spam policies address scaled content abuse.
- Reporting only sessions. Add visibility, branded demand, and conversions.
- Promising clients citations or traffic recovery. Neither can be guaranteed.
What Is Still Uncertain
Several important questions do not yet have solid answers.
- How much of the click decline is caused by AI Overviews versus other SERP features and behavior change. The studies are mostly correlational.
- How AI Mode will change site traffic over time, since Google says it can use different models and surface different links.
- Whether Google will add clicks and CTR to the dedicated generative AI report, since the reported metrics so far are impressions, pages, countries, devices, and dates.
- How stable current CTR figures are. Seer’s data moved substantially over fourteen months.
- Whether Google’s statement that clicks from AI Overviews are higher quality holds for your site.
Plan for ranges, not certainties, and revisit your assumptions regularly.
Frequently Asked Questions
Do AI Overviews reduce organic traffic?
Several independent studies report lower click-through on queries where an AI Overview appears, with estimates varying widely by method. Most are correlational, and your own effect depends on your query mix. Check your own Search Console data by query type instead of relying on an average.
Which queries are most affected?
Informational queries show the clearest losses in the studies read, because that is where AI Overviews most often appear. Branded and navigational queries appear less affected, though this should be checked in your own data.
Is SEO still worth it?
Google says SEO best practices still apply and that a page must be indexed and eligible to show in Search with a snippet to appear in these features. Goals may need to broaden beyond clicks to include visibility, branded demand, and conversions. No result is guaranteed.
Do I need special markup or an llms.txt file for AI Overviews?
Google says no additional requirements, and that you do not need new machine-readable files, AI text files, or special schema.org markup to appear in these features.
Can I opt out of AI Overviews?
Google describes controls such as nosnippet, data-nosnippet, max-snippet, and noindex that limit what appears in Search. These also affect regular results, so test carefully. Google-Extended applies to some other Google AI systems and is not described as a way to opt out of AI Overviews in Search.
How do I see AI Overviews in Search Console?
Google says AI feature appearances are included in the Performance report under the Web search type. Google has also begun rolling out dedicated generative AI reports to some sites. Check whether it is available in your account and what it includes.
Are clicks from AI Overviews better quality?
Google says clicks from pages with AI Overviews tend to be higher quality. The studies read measure click volume, not visit quality, so compare engagement and conversions in your own analytics.
What should a small business do first?
Compare year over year Search Console data, split queries by type, check the live results for your biggest declines, and protect the pages that drive leads. Then update your reporting to include conversions and branded searches.
Conclusion
AI Overviews are changing how people reach websites. The studies agree on the direction, disagree on the size, and mostly cannot prove cause. Google says SEO fundamentals still apply, and the pages that rank still have to earn their place. What changes is how much a ranking is worth on informational queries and how much else you need to measure.
Start with your own data. Find where clicks fell, which queries and which pages, and whether conversions followed. Then protect the pages that matter, add what only you can offer, build demand that does not depend on a single click, and report with more than sessions. That is a sturdier plan than reacting to any single headline number.